Report 1.13: Exits - Count Disaggregated
(Updated 10/1/2025)
Description: Reports the number of students who withdrew from the specified school year according to their exit category. The exits are disaggregated by ethnicity/race as well as gender.
Report Type: Certification (Fall 1)
Security Roles: Fall 1 Reports Role
Data As Of:
- Fall 1 Census Day (First Wednesday in October)
Basic selection criteria:
- SENR –
- Enrollment Exit Date within the Graduate/Dropout Reporting Cycle: August 16th of the prior academic year to August 15th of the current academic year
- Enrollment Status = Primary (10), Secondary (20), Short-Term (30)
- Grade Level = KN – 12
- SINF – record that wholly or in part overlaps a qualified enrollment.
- SPRG – based on dropout date range regardless of whether the record is owned by the school being reported
Report Filters: Filters can be selected resulting in only totals for the selected filter being displayed – legend on bottom of last page of report states which filter/s were selected
- Academic Year
- LEA
- Status
- School Type
- School
- Grade
- Gender
- Ethnicity/Race
- English Language Acquisition Status
- Title III Eligible Immigrant
- Title I Part C Migrant
- Socio-economically Disadvantaged
- NOTE: Free Meal program and Reduced Price Meal program criteria for SED includes Program Membership Start Dates from 7/1 – 10/31 of current academic year
- Students with Disabilities
- Gifted and Talented Education
- Exit Reason
Report Logic
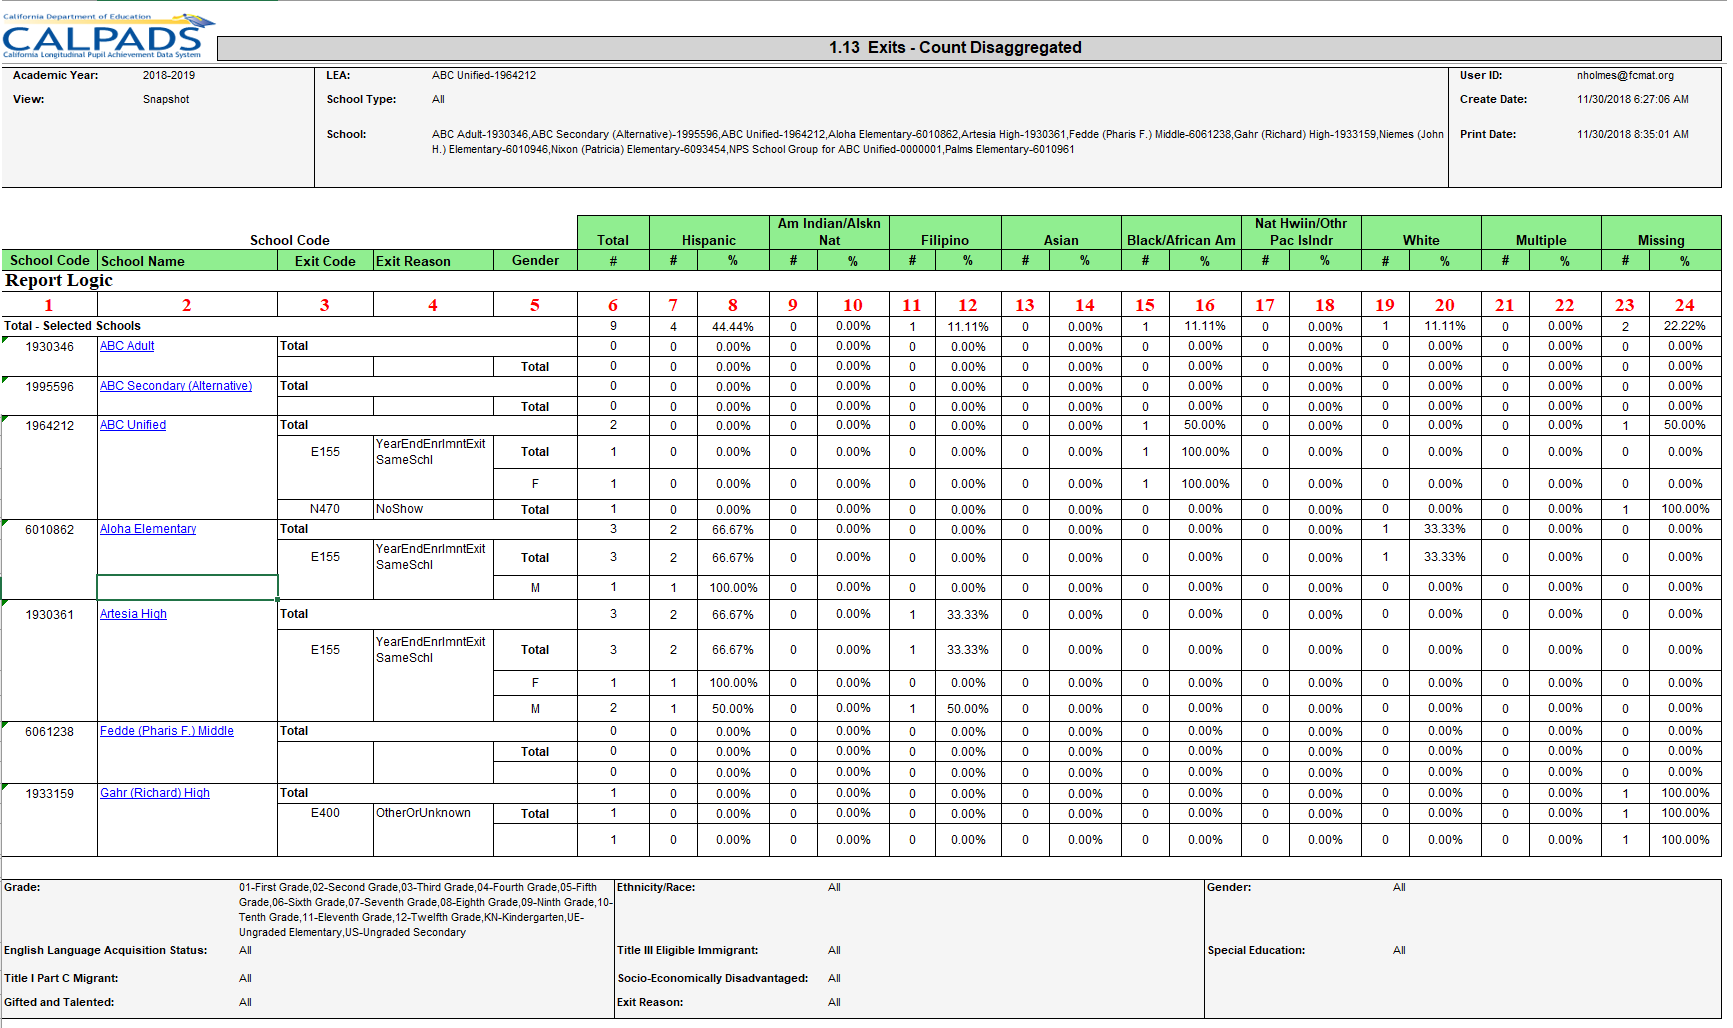
| Column | Rules |
|---|---|
| 1 | School code is derived from user ID permission and Expected Schools table |
| 2 | School Name is determined by #1 and the Expected Schools Table. School Name column leads to Report: 8.1 Student Profile List |
| 3 | Student Exit Code – from CALPADS Code Set |
| 4 | Student Exit Reason code description |
| 5 | Gender Code – this field can be expanded to show by Gender within Ethnicity and Race categories |
| 6 | Total Number # - Count of exits by Student Exit Category Code |
| 7, 9, 11, 13 ,15, 17,1 9 | Number (#) – Count of exits by Student Exit Category Code in each ethnicity/race disaggregated category |
| 8, 10, 12, 14 ,16, 18, 20 | Percentage (%) – Percentage of exits by Student Exit Category Code in each ethnicity/race disaggregated category |
| 21 | Number (#) – Count of exits by Student Exit Category Code with multiple race categories |
| 22 | Percentage (%) – Percentage of exits by Student Exit Category Code with multiple race categories |
| 23 | Number (#) – Count of exits by Student Exit Category Code with race code missing indicator selected |
| 24 | Percentage (%) – Percentage of exits by Student Exit Category Code with race code missing indicator selected |
Additional Resources
CALPADS File SpecificationsForm
Look for Student Enrollment (SENR), Student Information (SINF), Student English Language Acquisition (SELA), Student Program (SPRG) tabs for the fields indicated in the report logic.