Report 1.11: Completer Exits – Count Disaggregated (Retired as of 6/30/2020)
Description: Reports the number of Successful High School Completer Exits from the specified school year according by their completion status category. The completer exits are disaggregated by Ethnicity/Race as well as Gender.
Data Views / Type: Snapshot / Supporting (Fall 1)
Data As Of:
Fall 1 Census Day
Students Included: Successful High School Completers
Report Logic
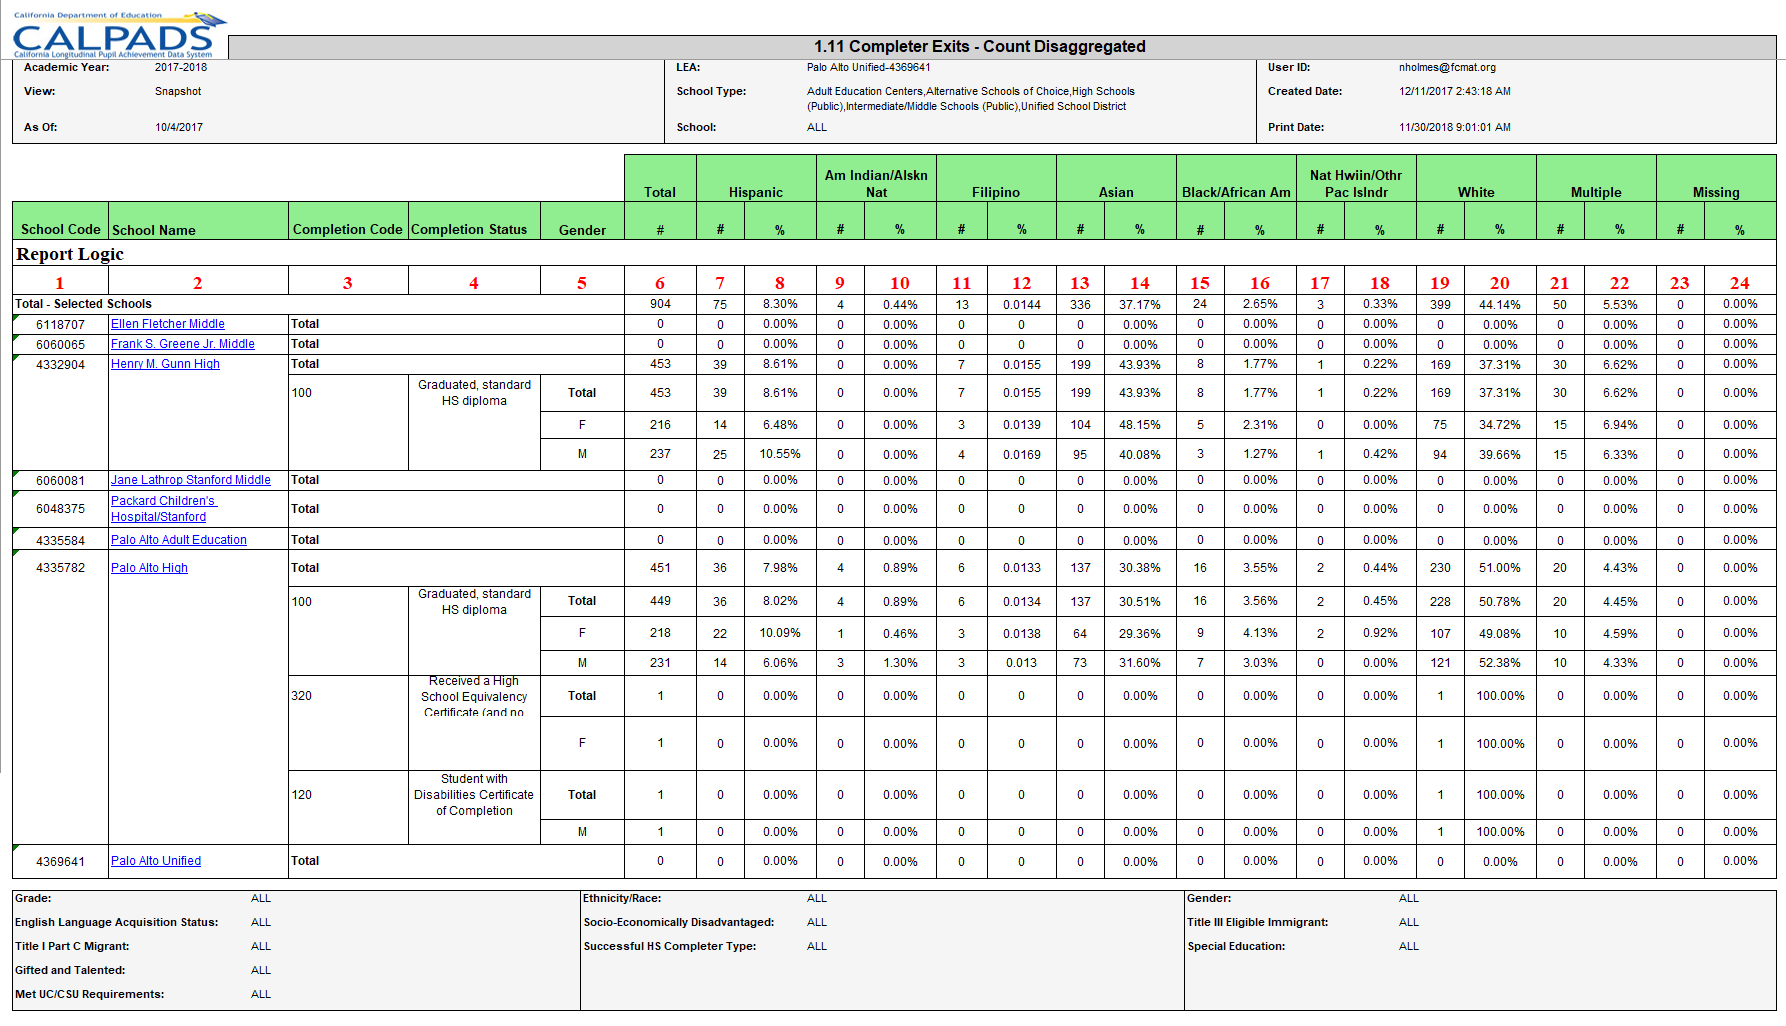
| Column | Rules |
|---|---|
| 1 | School code is derived from user ID permission and Expected Schools table |
| 2 | School Name is determined by #1 and the Expected Schools Table. School Name column leads to Report: 8.1 Student Profile List |
| 3 | Completion Code: List of coded values representing School Completion Statuses |
| 4 | Completion Status: Name of the corresponding Completion code value in column 3 |
| 5 | This field can be expanded to show by Gender within Ethnicity and Race categories. |
| 6 | Total: = Completers by School, the sum of Columns 7 & 10 from Report 1.9: Completers and Dropouts - Count |
| 7, 9, 11, 13 ,15, 17 | Number (#): Sum of Completers in each race category |
| 8, 10, 12, 14 ,16, 18 | Percentage (%): Percentage of Completerss for each race category |
| 19 | Number (#): Sum of Completers with more than one race category |
| 20 | Percentage (%): Percentage of Completers with more than one race category |
| 21 | Number (#): Sum of Completers with no race category |
| 22 | Percentage (%): Percentage of Completerss with no race category |
| 23 | Number (#): Sum of Completers with race code missing indicator selected |
| 24 | Percentage (%): Percentage of Completers with race code missing indicator selected |
Glossary References:
Successful High School Completer Data ,
GED,