Report 1.4: Enrollment Count – State View
(Updated 10/1/2025)
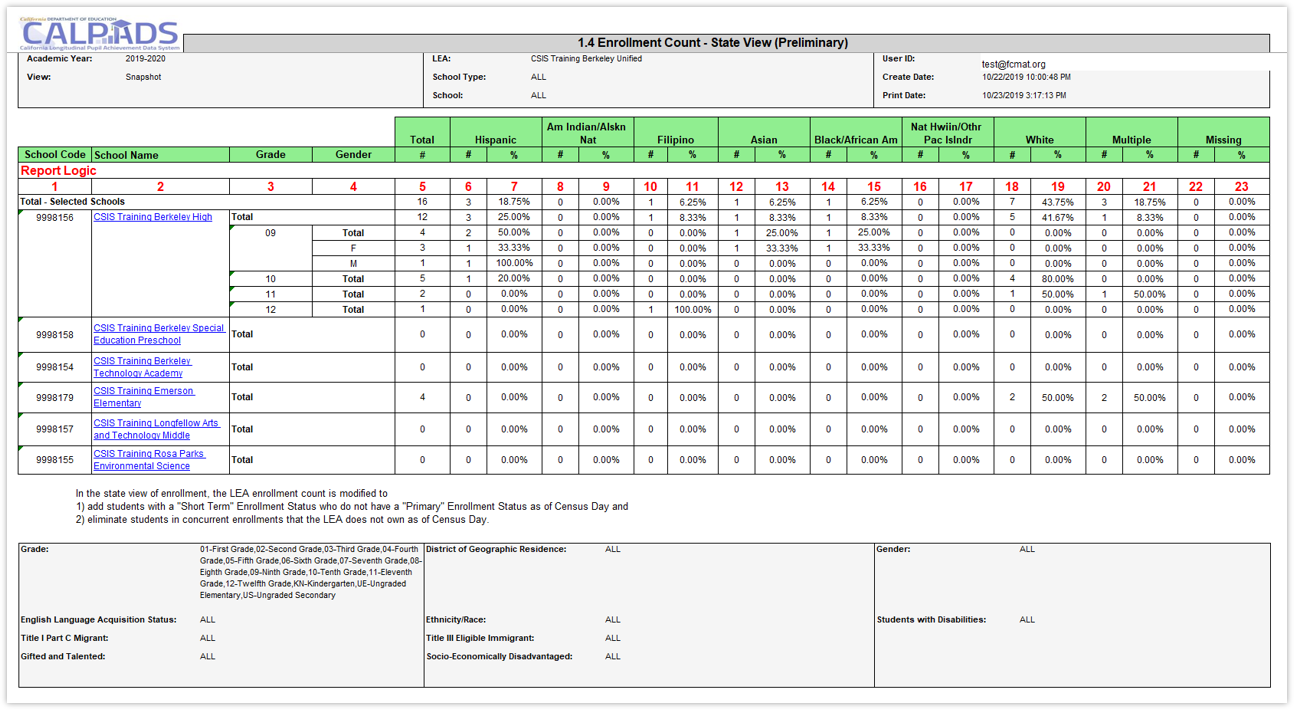
Description: Reports the statewide count of enrolled students at the school level within Race and Gender. The counts are disaggregated by Ethnicity/Race as well as Gender and Grade. This report is available during and after the Fall 1 certification window.
Report Type: Certification (Fall 1)
Security Roles: Fall 1 Reports Role
Data As Of:
- If Certification version, Fall 1 Census Day (First Wednesday in October)
Basic selection criteria:
-
Students Included: Students with an open enrollment on the “Data As Of” date, where: - Enrollment Status equals (10) Primary AND (30) Short Term Enrollment without a (10) Primary Enrollment - Grade Levels TK – 12
-
Note - Certification: Must have a SINF record that wholly or in part overlaps a qualified enrollment. Default Grade Level does not include PS since PS does not have to be certified.
Report Filters: Filters can be selected resulting in only totals for the selected filter being displayed – legend on bottom of last page of report states which filter/s were selected
- Academic Year
- LEA
- Status – (Certification)
- School Type
- School
- Grade
- Gender
- Ethnicity/Race
- Group By
- Grade or Gender - English Language Acquisition Status
- Title III Eligible Immigrant
- Title I Part C Migrant
- Socio-economically Disadvantaged
- NOTE: Free Meal program and Reduced Price Meal program criteria for SED includes Program Membership Start Dates from 7/1 – Census Day of current academic year.
- For 2020-2021 Only Free Meal program and Reduced Price Meal program criteria for SED includes Program Membership Start Dates from 7/1 – 12/31 of current academic year. - Students with Disabilities
- Gifted and Talented Education
- Student School Transfer Code
- District of Geographic Residence
Report Logic
| Column | Rules |
|---|---|
| 1 | School code is derived from user ID permission and Expected Schools table |
| 2 | School Name is determined by #1 and the Expected Schools Table. School Name column leads to Report: 8.1 Student Profile List |
| 3 | Grade Total: Sum of Enrollments by Grade. This field can be expanded to show by Grade within Ethnicity and Race categories |
| 4 | Gender Total: Sum of Enrollments by Gender. This field can be expanded to show by Gender within Ethnicity and Race categories. |
| 5 | Total: Sum of Enrollments by School |
| 6, 8, 10, 12 ,14, 16 | Number (#): Sum of Enrollments in each race category |
| 7, 9, 11, 13 ,15, 17 | Percentage (%): Percentage of Enrollments for each race category |
| 18 | Number (#): Sum of Enrollments with more than one race category |
| 19 | Percentage (%): Percentage of Enrollments with more than one race category |
| 20 | Number (#): Sum of Enrollments with no race category |
| 21 | Percentage (%): Percentage of Enrollments with no race category |
| 22 | Number (#): Sum of Enrollments with race code missing indicator selected |
| 23 | Percentage (%): Percentage of Enrollments with race code missing indicator selected |
Additional Resources
CALPADS File SpecificationsForm
Look for Student Enrollment (SENR), Student Information (SINF), Student English Language Acquisition (SELA), Student Program (SPRG) tabs for the fields indicated in the report logic.
Glossary References
Funding Eligible
English Learner
Foster Youth
Socio-Economically Disadvantaged Subgroup
Homeless
Migrant
Title III Eligible Immigrant
Students with Disabilities
Transitional Kindergarten