Report 3.2: Class Enrollment – by Content Area
(Updated 12/1/2025)
Description: Reports class size by content area category as of Census Day. Students are disaggregated into ethnicity/race categories.
Report Type: Certification (Fall 2)
Security Roles: Fall 2 Reports
Data As Of: Fall 2 Census Day (First Wednesday in October)
Basic selection criteria:
Students Included:
- Students with an open enrollment on the “Data As Of” date, where the Enrollment Status equals 10 (Primary), 20 (Secondary) or 30 (Short Term) and is in Grade Levels TK – 12.
- Course Section (CRSE) data and Student Course Section (SCSE) data are selected for the Academic Year being reported.
Course Data Rules:
- Course section with 0 enrollment: Not Included
- Course section with SEID = 9999999999: Included
- Course section where Independent Study Indicator = Y: Not Included
Report Filters: Filters can be selected resulting in only totals for the selected filter being displayed – legend on bottom of last page of report states which filter/s were selected
- Academic Year
- LEA
- Status – (Snapshot)
- School Type
- School
- Grade
- Gender
- Enrollment Status
- Content Area
- State Course Code
- Course Content Area Subcategory
- Local Course ID
- User Comments
Report Logic
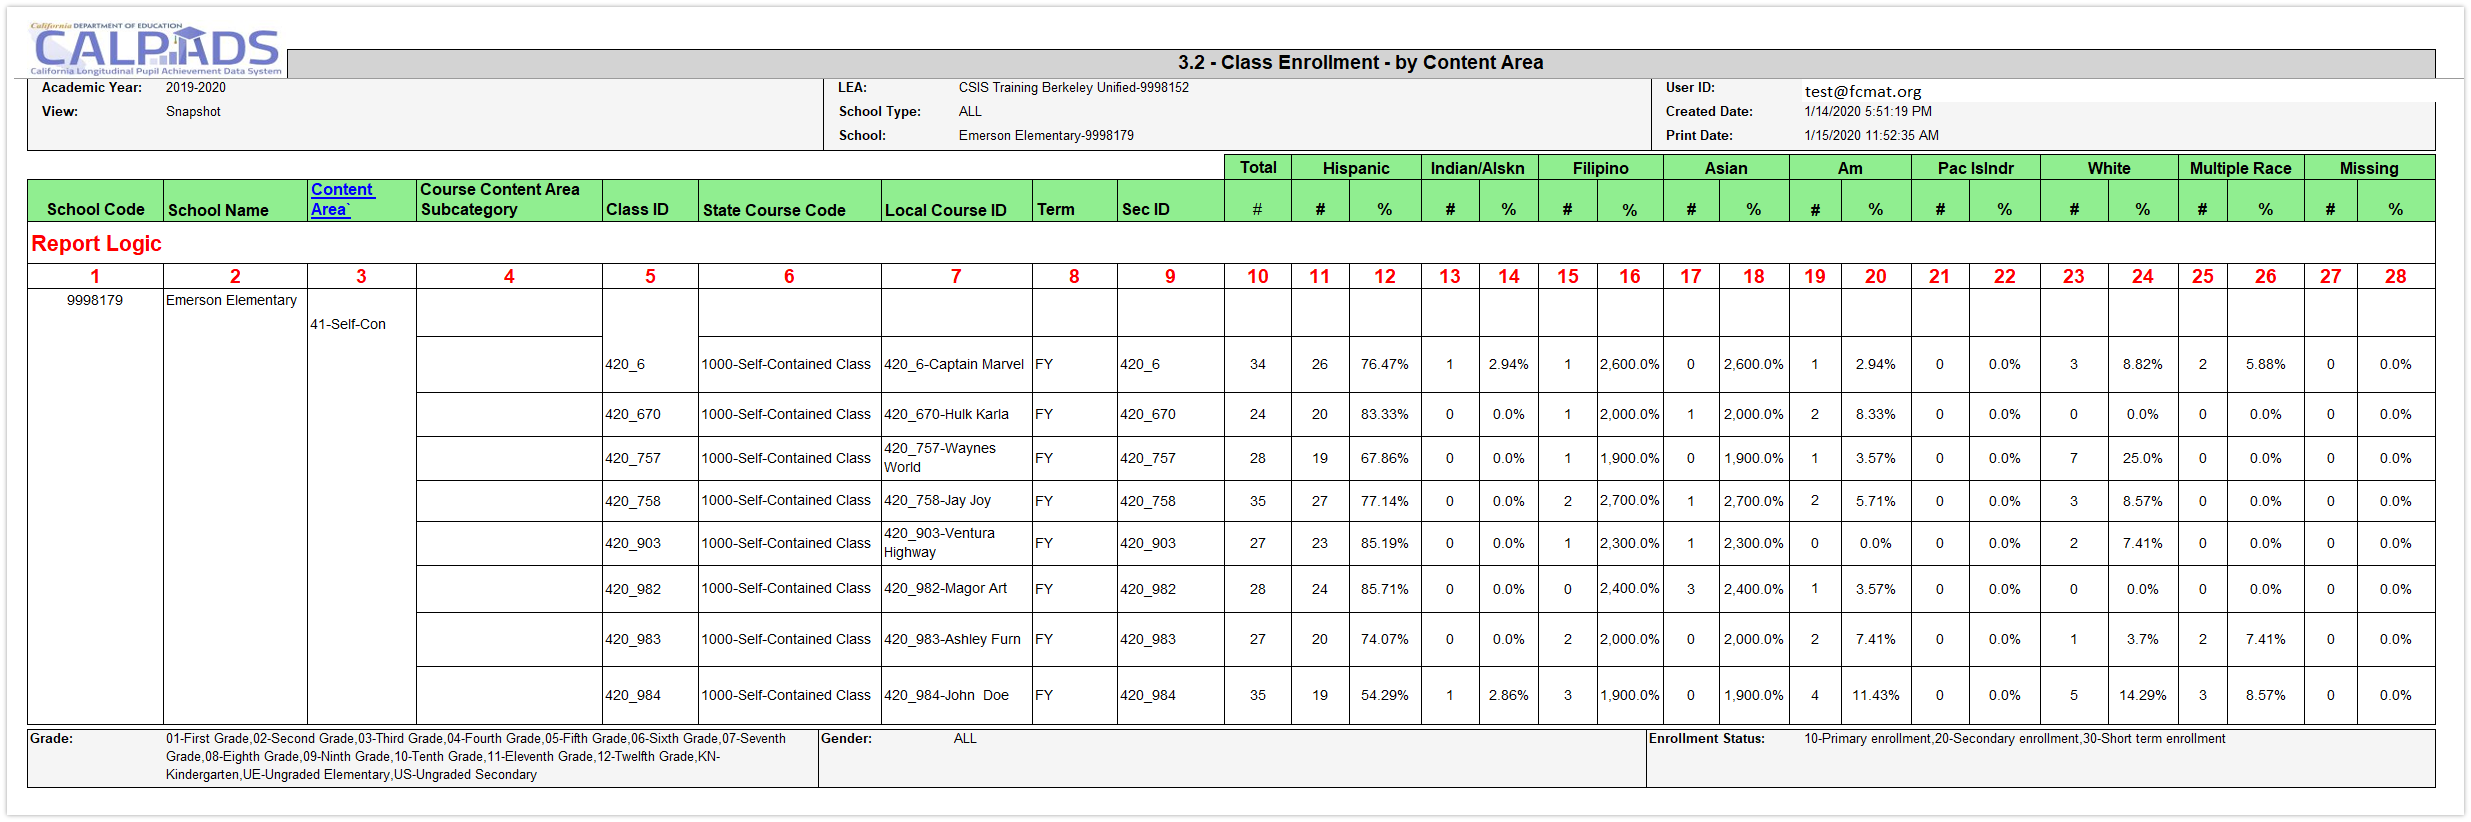
| Column | Rules |
|---|---|
| 1 | School code is derived from user ID permission and Expected Schools table |
| 2 | School Name is determined by #1 and the Expected Schools Table. |
| 3 | Use CRS‐State Course Code (9.07) to look‐up value in Course Group Master Combos document, Valid Code Combo sheet/tab, to derive corresponding Content Area code and name. |
| See the Content Area Category Assignment Code column on the Course Group Master Combos tab of the CALPADS Valid Code Combinations | |
| Leads to Content Area to Report 3.3 Classes Enrollment – Student List | |
| 4 | CRSE Field 9.28 – Displays the Course Content Area Subcategory |
| 5 | CRSE Field (9.18) Displays Class ID. A unique identifier for a Class derived and assigned at the local educational agency. The Class ID must be unique within a school by Academic Year. A Class ID represents a unique class in a school for an academic year. |
| 6 | CRSE Field 9.07 - Displays name of each State Course Code with student enrollment. |
| 7 | CRSE Field 9.08 and CRSE Field 9.09 – Displays Local Course ID and Course name. |
| 8 | CRSE Field 9.15 – Displays Academic Term Code |
| 9 | CRSE Field 9.14 – Displays Course Section ID |
| 10 | Count total students in each Class ID |
| 11 | SINF (Fields 2.23 and 2.25-2.29) Race/Ethnicity Hispanic number |
| 12 | SINF (Fields 2.23 and 2.25-2.29) Race/Ethnicity Hispanic percentage |
| 13 | SINF (Fields 2.23 and 2.25-2.29) Race/Ethnicity Am Indian/Alaska Native number |
| 14 | SINF (Fields 2.23 and 2.25-2.29) Race/Ethnicity Am Indian/Alaska Native percentage |
| 15 | SINF (Fields 2.23 and 2.25-2.29) Race/Ethnicity Filipino number |
| 16 | SINF (Fields 2.23 and 2.25-2.29) Race/Ethnicity Filipino percentage |
| 17 | SINF (Fields 2.23 and 2.25-2.29) Race/Ethnicity Asian number |
| 18 | SINF (Fields 2.23 and 2.25-2.29) Race/Ethnicity Asian percentage |
| 19 | SINF (Fields 2.23 and 2.25-2.29) Race/Ethnicity Black/African Am number |
| 20 | SINF (Fields 2.23 and 2.25-2.29) Race/Ethnicity Black/African Am percentage |
| 21 | SINF (Fields 2.23 and 2.25-2.29) Race/Ethnicity National Hawaiian/Other Pacific Islander number |
| 22 | SINF (Fields 2.23 and 2.25-2.29) Race/Ethnicity National Hawaiian/Other Pacific Islander percentage |
| 23 | SINF (Fields 2.23 and 2.25-2.29) Race/Ethnicity White number |
| 24 | SINF (Fields 2.23 and 2.25-2.29) Race/Ethnicity White percentage |
| 25 | SINF (2.25-2.29) Multiple Race number |
| 26 | SINF (2.25-2.29) Multiple Race percentage |
| 27 | Race/Ethnicity Missing number |
| 28 | Race/Ethnicity Missing percentage |